Containerised storage
A nominal 5 MWh-class liquid-cooled LFP family. Power conversion, transformers and plant controls are scoped separately.

 Let’s talk ↗
Container and cabinet storage selected for your load, discharge duration and operating schedule.
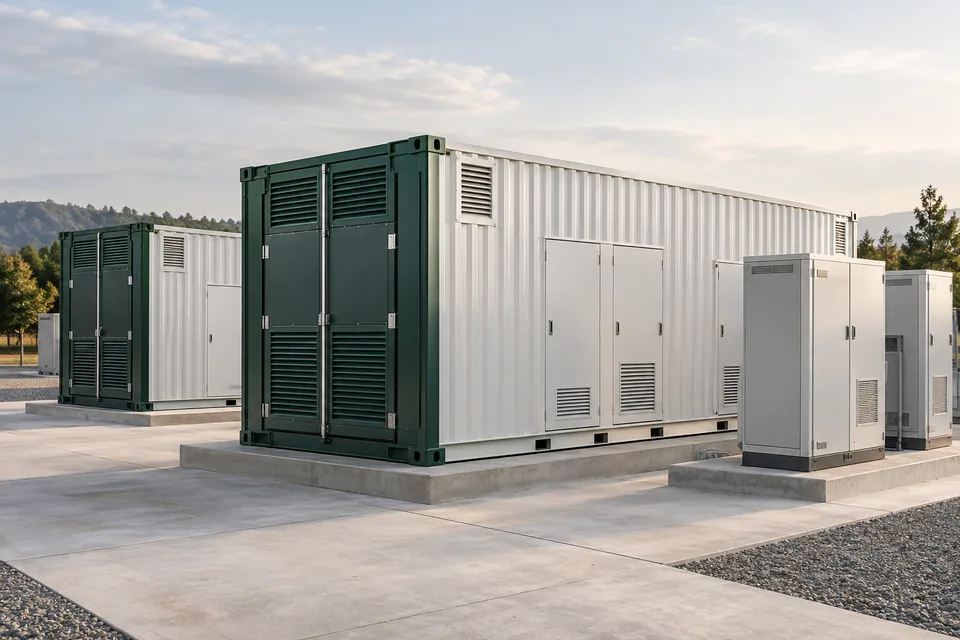
Define the required power, usable energy, cycle schedule and connection point. We help select manufacturer-supplied storage and agree the battery, conversion and control interfaces.
A nominal 5 MWh-class liquid-cooled LFP family. Power conversion, transformers and plant controls are scoped separately.
Cabinet storage for commercial, industrial and renewable applications. Confirm power, energy, interfaces and cooling for the selected model.
Assess containers, conversion and step-up equipment together. Usable energy and discharge duration follow the project design.
Confirm ratings, compliance evidence and availability for the selected model.
| Parameter | Family / selection basis | Project consideration |
|---|---|---|
| Format | 20-foot container | Liquid-cooled LFP storage |
| Energy | Nominal 5 MWh class | Final usable capacity depends on the selected configuration and duty. |
| Supply boundary | Battery container and its internal systems | PCS, transformer and plant-level controls are separate unless included in the offer. |
Representative manufacturer container data, reviewed August 2026. Nominal DC energy is not usable AC energy.
Request the model datasheet ↗| Parameter | Family / selection basis | Project consideration |
|---|---|---|
| Battery technology | LFP in the representative container family | Confirm the exact cell, rack and system configuration. |
| Energy basis | Nominal 5 MWh class | Usable DC energy and energy at the connection are separate quantities. |
| Thermal management | Liquid-cooled container family | Auxiliary power and performance depend on operating conditions. |
| Installation | Outdoor container / C&I cabinet options | Check foundations, access, ventilation, fire strategy and maintenance clearances. |
| Electrical interface | Battery DC side; conversion and step-up as scoped | Define PCS, transformer, controls, auxiliaries and the connection boundary. |
| Evidence | Model-specific datasheets, tests and certification scope | A subassembly certificate does not establish acceptance of a complete site installation. |
Evaluate peak demand, discharge windows and the actual tariff or operating constraints.
Consider generation variability, export limits and the intended charging schedule.
Define the required continuity duty with the conversion, protection and control architecture. BESS is not automatically a UPS replacement.
Explore a Singapore example below, or ask us to assess your site without choosing a system size. For another market, enter your own figures.
One example does not establish whether your site is a good fit. These are applications to assess, not additional earnings assumed by the calculator.
Compare when energy is available with when the site needs it. Tariffs, losses, solar export value and charging capacity determine the opportunity.
Eligible demand response or wholesale activity may add value. Confirm access, fees and a compatible operating plan. The market-participation example already includes both income streams.
Assess the value of continuity against outage risk, required duration and the complete backup design. Backup value is site-specific and is not included in these figures; BESS is not automatically a UPS replacement.
For each modelled year, delivered energy per operating day is the smallest of: remaining usable AC capacity; AC power × discharge hours; AC power × charging hours × round-trip efficiency; and available site load × discharge hours. Charge and discharge windows are separate and total no more than 24 hours. This represents one sequential daily cycle, with a repeatable load and tariff schedule.
Annual charging energy = annual delivered energy ÷ efficiency. Gross savings = avoided energy cost − charging energy cost. Net operating savings = gross savings − annual non-energy O&M − additional auxiliary electricity cost. Capacity declines by the entered percentage each year, compounded. The operating break-even rate covers charging, O&M and auxiliary costs; it does not recover the installed cost. No tariff escalation or cost inflation is assumed.
Simple payback = (installed cost − confirmed upfront grant) ÷ first-year net benefit; it ignores subsequent capacity fade. Cumulative payback and closing net cash use each modelled year’s net savings, with payback interpolated within the crossing year. A crossing followed by declining cash is flagged. These are undiscounted, unlevered screening cash flows, not IRR or NPV.
No financing, tax benefits, unentered grants, replacement, augmentation or residual value are modelled. New demand charges, tariff switching costs and minimum-bill effects must be included in the net capacity saving or assessed separately. Enter costs on a consistent tax basis. Added charging demand can increase a real bill; confirm spare supply capacity. Multiple daily windows, interval-load variations and solar opportunity costs need a time-series study. A loss-making schedule is shown as a loss; the model does not assume optimal dispatch avoids it.
Optional model: net annual benefit = energy margin + entered capacity-charge savings + grid-service gross revenue − percentage service fees − extra service costs − base O&M − base auxiliaries. Tariff mode scales the physical energy schedule by the retained-activity percentage. Wholesale mode replaces that entire margin with an external study’s year-one margin, scaled by compounded capacity fade. This simple scaling is not an interval dispatch model. Optional benefits and associated service costs stop after the specified term; no renewal is assumed. Capacity and service figures stay constant during that term and must be supportable despite battery degradation. Grant support is deducted once at time zero. The comparison baseline retains the full original tariff schedule and all base costs, without a grant or other benefits. It is a separate alternative, not added to the combined case.
Singapore opportunities depend on market access and approval: EMA Demand Response / Interruptible Load; ESS grid services; wholesale electricity purchasing. No automatic Singapore subsidy or service income is assumed.
The loaded Singapore what-if case allocates 230 days/year to wholesale shifting and 20 separate days to Demand Response, within the 250-day activity assumption. Year-one wholesale margin = 200 kWh × 230 days × an assumed SGD 0.20 net margin per delivered kWh = SGD 9,200, after charging, losses and trading fees. This net margin is hypothetical, not an observed USEP spread. DR gross payments = 100 kW × 1 hour × 20 assumed events × an illustrative SGD 2/kWh payment = SGD 4,000. This is a teaching simplification, not Singapore’s actual settlement formula or a promised event count. Actual DR payments depend on programme settlement and performance. A 15% service fee and SGD 1,000/year extra costs are deducted; the latter is an illustrative allowance for DR recharge energy, wear, metering and other charges. No DR avoided-electricity benefit is added, and no tariff-shifting margin is added to wholesale earnings. No capacity-charge saving or grant is assumed.
Both illustrative income streams run for the same ten-year horizon as the baseline, purely to compare scenarios; this assumes continued access and income, not a confirmed contract. Shorten the benefit period to the supported term for a project assessment. Wholesale margin follows the model’s capacity-fade scaling; the fixed 100 kWh DR event duty fits the example’s remaining energy capacity during that period. Separate event days avoid assumed simultaneous discharge, but do not establish actual eligibility, baseline compliance, event availability or a feasible dispatch plan. Replace all revenue and cost estimates with an aggregator proposal and interval dispatch study for a real project.
The Singapore energy-only comparison uses SP Group’s published High Tension Small energy rates for 1 October–31 December 2026: SGD 0.2609/kWh peak (07:00–23:00) and SGD 0.1520/kWh off-peak (23:00–07:00), before GST. These are a dated tariff reference, held constant in the model, not a ten-year price forecast. Confirm eligibility and your actual retailer contract. Low-tension non-domestic regulated supply uses a flat rate instead; it has no peak/off-peak energy spread. Capacity and reactive-power charges are excluded; the example assumes spare charging capacity without additional demand charges.
Illustrative system assumptions: 100 kW / 200 kWh usable AC, 100 kW sustained site load, 4 charging hours within the off-peak band and 2 discharge hours within the peak band, on 250 days/year. Planning placeholders before GST: SGD 130,000 installed, SGD 1,950/year non-energy O&M and SGD 650/year extra auxiliary electricity. These are not verified Singapore installation prices or a quotation. Efficiency is 85%, annual capacity reduction 2%, and horizon 10 years; confirm performance at the site connection, including transformer losses where applicable. All values are editable. Example-based labelling remains on edited results and enquiry summaries; start with your own figures to clear it.
Assumptions reviewed 30 September 2026. Use current bills and the selected-model quotation. Sources: SAM storage modelling; ATB commercial storage efficiency; the Singapore tariff source above. US cost benchmarks are not used as Southeast Asian installed prices.
| Year | Delivered kWh | Net savings | Cumulative net cash |
|---|
No. MWh measures energy; MW measures power. Specify both, including usable energy, discharge duration and losses.
Only if included in the quote. Agree the scope for batteries, PCS, transformers, plant controls and site works.
Request datasheets, test records and certification scope for the selected model.
Tell us what you’re planning.
Technical details can follow.